

About comparison diagrams
Comparison diagrams can show you what two items have in common and where they differ.
In this topic
Watch the video
What is a comparison diagram?
You can generate a comparison diagram to compare two of the same type of project items—for example, sources, nodes or cases—to see their similarities and differences.
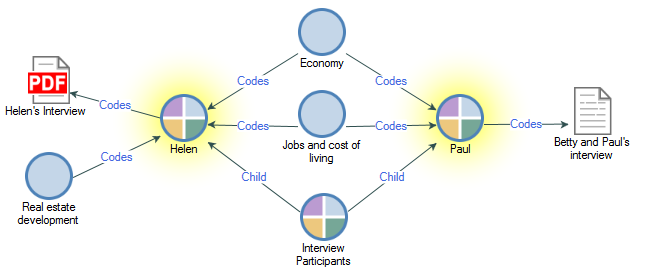
For example, this diagram compares the cases Helen and Paul.
-
Both Helen and Paul are coded at the nodes Economy and Jobs and cost of living,
-
Both Helen and Paul are children of the parent case, Interview Participants.
-
Helen is coded at the node Real estate development but Paul is not.
You can change the type of associated items that are displayed on the diagram—for example, you might show child nodes and hide memo links.
Comparison diagrams are not retained in your project when you close them or when you close NVivo. If you want to keep a particular diagram, you could copy and paste it into a memo or export it as an image file.

What can I use comparison diagrams for?
You can use comparison diagrams to see:
-
Which sources have been coded at particular nodes.
-
When two cases have talked about the same topic.
-
What two project items have in common, and what is unique to each item.