

Understand sociogram centrality measures
You can view the centrality measures underlying the connections in a sociogram in grid format. NVivo uses the Stanford Network Analysis Project (SNAP) to calculate centrality measures.
In this topic
- Important things to know
- Degree centrality
- Betweenness
- Closeness
- Density
- Reciprocity
- Why are scores in NVivo different to my other tools?
Important things to know
It is important to consider carefully the different types of relationships and cases in your project, because this will impact the meaningfulness of the centrality measures represented in a network.
NVivo sociograms are multiplex networks, meaning that different kinds of relationships (edges) can be shown on the one network. For example, associative and directed. NVivo sociograms are also multi-modal meaning that you can have more than one type of case (vertex) in a network. For example, cases for people and cases for organizations.
Limiting the sociogram to one type of edge or vertex can simplify the interpretation of the centrality measures. If your project contains a mix of relationship types and a mix of case types, be aware that even though you can generate sociograms for this mixed data, it doesn't mean that you should. Generating a sociogram from a mix of vertex types and edge types can affect the relevance of the centrality measure scores of the resulting network.
For example, your types of cases could predicate that relationships can only go in one direction. If you have cases for people and cases for organizations, the relationship "is a member of" can only run from person to organization. In a multiplex, multi-modal network, this can result in a meaningless reciprocity score because an organization can never be a member of a person.
Similarly, if you have no relationship type that can run between two organizations, it can limit the density score in a multiplex network, because degree takes the potentiality of connections across the entire network into the calculation. There is no potential for an edge between two organizations if the relationship type doesn’t exist.
Be careful when drawing conclusions from the centrality measures—you need to know what they mean in the context of your data.

Degree centrality
Degree centrality is the count of the number of vertices a vertex is directly connected to.
Degree is often used as a measure of a vertex's degree of connectedness and consequently, their popularity and influence. This can be useful to determine which cases are pivotal to spreading information and influencing others in the network. For example, How many people can this person reach directly?
Degree In and Degree Out
A count of the number of links that have a direction into vertices, and out of vertices. For example, How many vertices have a relationship to Vertex A compared with from Vertex A?
Degree In and Degree Out scores are only available if at least one edge in the network is a directed link (either one way or symmetrical). If all edges in the network are undirected links, the degree in and degree out score is blank.
Associative links have no inherent direction. If your network is made up entirely of associative edges, NVivo treats it as an undirected network and therefore, it has a degree in and degree out score of blank.
If any one link in the network is directed, NVivo treats the network as directed. Associative links in a directed network are treated as symmetrical.
Associative and symmetrical links count as both in and out.
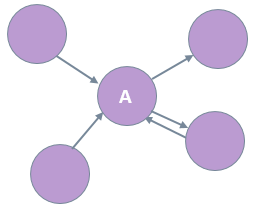
In this example, for vertex A:
-
Degree Centrality is 4.
-
Degree In is 3.
-
Degree Out is 2.
NOTE: NVivo calculates degree by counting the number of vertices that are connected (and not the number of edges between A and other vertices).
Betweenness
Betweenness is how often the vertex lies on the shortest path between two other vertices.
Betweenness shows which cases are communication paths between other cases which can be useful to determine points where the network would break apart. For example, Which person is most likely to have the most information flowing through them?
It is important to understand that betweenness is defined differently from one social network analysis tool to another. NVivo uses SNAP and the Brandes (2001) algorithm to calculate betweenness centrality.
In NVivo, the betweenness score is calculated as a proportion of the shortest paths. The shortest path is determined irrespective of the directionality of the links.
In an undirected network, the betweenness score for a specific vertex represents the number of the shortest paths between every other vertex that passes through the specific vertex in question. In NVivo, vertex pairs are not directed—A to B is the same as B to A.
In a directed network, A to B is different from B to A but we don't take into account the directionality of the edges that lie between the pairs. In effect, given the same network patterns, the betweenness score is twice as large in a directed network than an undirected network. The shortest paths are not formed tail to end.
NVivo doesn't take edge weight or multiplicity into account for betweenness. For example, five retweets is considered as equivalent to one retweet.
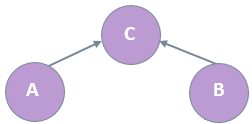
In this example directed network:
-
From A to B there are two shortest paths—C occurs on both of these.
-
We also need to consider B to A.
-
The betweenness score for this directed network is 2.
NOTE: The directionality of the arrow heads are irrelevant.
Closeness
Closeness is a measure of reach—the speed with which information can reach other cases from a given starting point. It can be an indicator of who has the easiest and quickest access to information in the network. For example, How fast can this person reach everyone in the network?
To calculate closeness, NVivo uses the sum of the shortest distances from the specific vertex in question to every other vertex connected in the network.
Any vertex not connected via any path is considered to have a distance from the specific vertex in question of zero. Therefore, closeness is only calculated amongst those vertices that are connected.
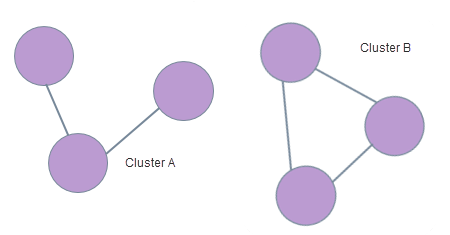
In this example network, connections in Cluster A have no impact on the closeness of Cluster B.
Density
The density score displays in the Status bar.
Density is the count of vertex pairs that are connected in a diagram, divided by the total number of possible connections that could exist. The density score shows the level of connectedness in the network.
In NVivo, edge weight and multiplicity aren't taken into account.
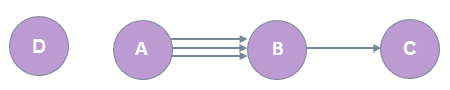
In this example network, the three edges between A and B only form one connected pair.
-
The number of vertices is 4.
-
The total number of possible connections is 12.
-
The density score is 0.167.
Reciprocity
The reciprocity score displays in the Status bar.
Reciprocity is a measure only used for directed networks. It shows the percentage of edges in the network that are reciprocated. For example "Are there relationships in the opposite direction between the same people?"
In NVivo, edge weight and multiplicity aren't taken into account. If there are two out-going edges and only one in-coming edge, it's equivalent to one edge in each direction—both being considered as reciprocated.
Why are scores in NVivo different to my other tools?
The calculation of network centrality values can be very complex. Calculation methods are often not standard across social network analysis tools, for example how directionality and edge weight are considered.
If want to calculate centrality measures differently, or if you want to apply additional statistical measures, you can export the edge list of your sociogram to a Pajek (.net) file and import it into another tool. Refer to Copy and export sociograms (Export a sociogram as an edge list) for more information.