Summary and group options
This feature is available in NVivo Pro and Plus editions. Learn more
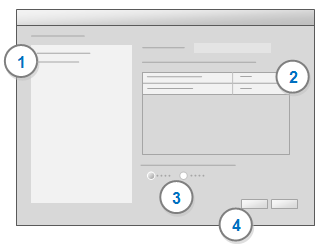
The Summary Options dialog box, which is available from both the Report Wizard and the Extract Wizard, allows you to display summary information—for example, the total number of records—instead of individual records.
The Grouping Options dialog box, which is available from the Report Wizard, allows you to display summary information for each group of records in a report.
What do you want to do?
- Use summary options instead of displaying all records
- Use group options to display totals for each group
Use summary options instead of displaying all records
You can display summary information—for example, count, sum, average—rather than showing every record for a field. For example, you could display the number of journal articles, interviews, and books in your project by creating a report on the number of sources that belong to each classification. (See example report.)
You define the summary options on Step 2 of the wizard after you have selected the view and the fields to be included in your report or extract.
-
On Step 2 of the wizard, click Summary Options. The Summary Options dialog box opens.
-
Identify the field that you want to summarize and select Count records from the list.
-
Click OK and continue with the remaining steps in the wizard—refer to Create reports using the Report Wizard or Create extracts using the Extract Wizard.
NOTE
-
Use Count values if you want to count unique occurrences of each value. For example, to display the number of users coding at each node, you can choose to count values.
-
You can also display other summary information—for example, you can show the average number of coding references. The available summary options depend on the type of data being summarized.
Use group options to display totals for each group
If your report includes groups of data, you can display totals or other summary information about the detail in each group. For example, you could report on people in your project divided into age groups with a count of the number of people for each age group. (See example report).
Before defining the group options, you need to specify one or more grouping levels for your report—refer to Create reports using the Report Wizard for more information.

To display total number of records for each group:
1 In the Grouping levels list, select the group you want to total.
2 Select Count records for the field you want to total.
3 By default, Header is selected. This displays the total above the records. Click Footer if you want the total to display below the records.
4 Click OK.
NOTE
-
Use Count values if you want to count unique occurrences of each value.
-
You can also calculate other summary values—for example, you can show the average number of coding references. The available summary values depend on the type of data being summarized.


