

Create a cluster analysis diagram
This feature is available in NVivo Pro and Plus editions. Learn more
Cluster analysis can help you to see patterns in your data. This topic explains the ways you can create a cluster analysis diagram.
What do you want to do?
- Create a cluster analysis diagram using the wizard
- Generate a cluster analysis diagram for selected sources or nodes
- Visualize patterns in social media datasets
- View Word Frequency query results as a cluster analysis diagram
Create a cluster analysis diagram using the wizard
-
On the Explore tab in the Diagrams group, click the Cluster Analysis image.
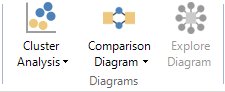
The Cluster Analysis Wizard opens.
- Follow the steps in the wizard, and then click Finish.
NOTE Refer to About cluster analysis (Cluster by word, coding or attribute value similarity) or About cluster analysis (Selecting a similarity metric) for more information about the options in the wizard.

Generate a cluster analysis diagram for selected sources or nodes
You can also create a cluster analysis diagram while working with sources or nodes in List View.
-
In List View, select the sources or nodes that you want to compare in a cluster analysis diagram.
-
On the Explore tab, in the Diagrams group, click the arrow below Cluster Analysis, and then click Cluster Analysis of Sources or Cluster Analysis of Nodes.
The Cluster Analysis Options dialog box opens.
- (Optional) Change the default options—refer to About cluster analysis (Cluster by word, coding or attribute value similarity) or About cluster analysis (Selecting a similarity metric) for more information.
- Click OK.
Visualize patterns in social media datasets
Cluster analysis enables you to compare similarity of words in social media datasets. For example, you can visualize the similarities and differences across users in a:
-
Facebook dataset You may discover new insights—for example, how similar are the posts or comments from various users? For more information, refer to Approaches to analyzing Facebook data.
-
Twitter dataset You may find other Twitter users that share similar views—for example, what other Twitter users use similar words to world_wildlife? For more information, refer to Approaches to analyzing Twitter data.
-
YouTube datasets If you have collected comments on a YouTube video, you can find users who posted comments with similar words. For more information, refer to Approaches to analyzing YouTube comments.
View Word Frequency query results as a cluster analysis diagram
You can also view Word Frequency query results as a cluster analysis diagram. This type of cluster analysis diagram displays the up to 100 most frequently occurring words in the selected sources or nodes. Refer to Run a Word Frequency query for more details.