

Import data from spreadsheets and text files
This feature is available in NVivo Pro and Plus editions. Learn more
You can import data from a Microsoft Excel spreadsheet or a text file containing comma or tab-separated values. For example, you might want to import a spreadsheet containing survey responses.
If you have collected survey responses using SurveyMonkey or Qualtrics, you can import the responses directly into NVivo. Refer to Import from SurveyMonkey and Import from Qualtrics for more information.
NOTE: The Survey Import Wizard is available in NVivo 11 (Update 2). If you are using an earlier version of NVivo, you will see the Import Dataset Wizard. Refer to Software updates for information about upgrading.
What do you want to do?
- Gather your data
- Consider how you want to use your data in NVivo
- Prepare a spreadsheet or text file for import
- Import a spreadsheet or text file
- Work with your dataset
Gather your data
You cannot add additional rows or columns to a dataset after import, so it is important to gather your data before you start the import operation.
For each dataset that you want to create, your data must be gathered into one of the following:
-
Microsoft Excel spreadsheet (.xlsx or .xls)
-
Tab or comma delimited text file (.txt or .csv)
Text files must be organized as a tab or comma-delimited field values, so that the Survey Import Wizard can divide the contents into rows and columns. Each record must be on a separate line, and each field must be separated by the delimiter. The following is an example of a comma-delimited text file:
You cannot select multiple worksheets (within a spreadsheet), so the data you want to import must be gathered into a single worksheet.
The maximum amount of data that can be imported into a single dataset is 256 fields (columns) and 1,048,576 records (rows).

Consider how you want to use your data in NVivo
You cannot change the analysis type (codable or classifying) of a column after import, so you should decide how you want to use your data before you import a dataset.
Open-ended questions that contain data you want to analyze are created and coded to nodes (codable)—for example, responses to open-ended survey questions such as How do you think we can reduce our carbon emissions?
Close-ended questions that describe your data (metadata) are created as attributes (classifying)—for example, the ID number, Age, Gender and Annual Income of your survey respondents. Values in classifying fields:
-
Can be used to sort and filter the records in your dataset.
-
Provide context when you view coded dataset content in a node.
-
Can be used to build case node structures that group your codable content—for example, by Age or Sex.
Surveys must contain a unique identifier that identifies the responses of each individual. A unique identifier could be the respondent's name, however, in a large survey, names may not be unique. For uniqueness and to protect the identity of your respondents, you may prefer to manually assign each respondent a unique ID number. You can then gather all responses of an individual respondent to a single node—refer to Approaches to analyzing survey results for more information.
Prepare a spreadsheet or text file for import
-
Open the file that contains your data in a text editor or Microsoft Excel:
-
Text files should be opened in a text editor, such as Notepad.
-
Spreadsheets should be opened in a spreadsheet application, such as Microsoft Excel.
-
If you are importing data from Excel, ensure that the data is gathered into a single worksheet.
-
For both text files and Excel spreadsheets, review your data as described below:
| Element | Description |
| Blank rows | Remove any blank rows within the data. |
| Extraneous content | Your file should contain only the rows you want to import, and (optionally) up to 2 rows containing field labels. Any other content should be removed. |
| Data types | Make sure every value in a field contains a consistent type of data. For example, date fields contain dates and not text. |
-
If you are importing a text file, review your data as described below:
| Element | Description |
| Records | Each record must be on a separate line. Remove any blank lines at the beginning or end of the file. |
| Field delimiters | Make sure that the file consistently uses tabs or commas to separate field values. |
| Text qualifiers | Some delimited text files contain field values enclosed in
single or double quotation marks, for example:
The single or double quotation mark that encloses the field value is a text qualifier. Field values must be enclosed within text qualifiers when the field delimiter (comma or tab) appears within field values. For example, if comma is the field delimiter, and Dallas, Texas is a valid field value, you must enclose the value within qualifier, like this: "Dallas, Texas" During the import operation, you can specify whether the file uses a text qualifier, and whether the qualifier is the single or double quotation mark. |
-
If you are importing data in an Excel Spreadsheet, review your data as described below:
| Element | Description |
| Merged cells | Merged cells can cause errors during the import operation. We recommend that you do not import spreadsheets containing merged cells. |
| Calculated values | If a cell displays a calculated value, the displayed value (not the formula) is imported into the dataset. |
| Error values | If any of the cells in your worksheet display error values such as #NUM or #DIV, you should correct them before you start the import operation. Columns containing error values can only be imported as text fields. |
| Buttons and checkboxes | If any cells contain controls such as buttons or checkboxes the spreadsheet cannot be imported. You should remove these controls before import. |
-
Close the text file or spreadsheet. Keeping the file open may cause errors during the import operation.
Import a spreadsheet or text file
The Survey Import Wizard examines the data you are importing and helps you to ensure that the data is imported the way that you want.
-
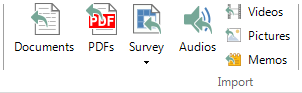
On the Data tab, in the Import group, click the arrow below Survey, and then click From Microsoft Excel File or From Text File.
- Click the Browse button, and then locate and select the file you want to import.
- Click Open. The Survey Import Wizard opens.
- Follow the instructions in the Survey Import Wizard. For more information about using the Wizard, refer to the following table:
| Wizard step | Description |
|
Introduction |
Understand the outcomes of the survey import. NVivo will import your data as a dataset, as well as create cases, nodes and attributes in your project. |
|
Check your data format |
For Spreadsheets
For text files
Check the Data Preview to make sure the settings are right for your data. |
|
Manage your survey respondents
|
|
|
Identify open-ended and closed-ended questions
|
A preview of the first response in your survey is presented in a grid. On this screen you choose which fields contain open-ended values that you want to code (codable fields) and which fields contain closed-ended values that describe your respondents (classifying fields).
An open-ended question is generally a free response that you want to analyze for themes or ideas that arise. Close-ended questions are useful to describe respondents and ask questions of your open-ended questions. NOTE: You can change the question name—for example, to make it shorter or more meaningful. Click on the question and edit it. Press ENTER or TAB to save your changes. |
|
Auto code themes and sentiment (NVivo Plus only) |
NVivo Plus users can choose to automatically detect and code themes and sentiment in their open-ended survey responses. |
-
Click Close when the Wizard is finished. A dataset source is created.
If you coded for themes and sentiment, NVivo presents the results visually in a results matrix and hierarchy chart. (NVivo Plus only)
NOTE
-
It can take some time to import and process surveys. This depends on the number of questions, the number of responses, and the amount of text in the responses. The larger your survey, the longer it will take to import.
Work with your dataset
After importing a dataset, a node is created for each open-ended survey question—a useful starting point for further exploration.
A case node is created for each respondent which gathers all of a respondent's answers together. Descriptive data is created for the cases using the closed-ended (classifying) information in the dataset—this allows you to compare respondent attitudes based on attributes like age or gender.
You can use a number of techniques to analyze the data—for example, you could:
-
Code the content—select the text in a codable field and code at new or existing nodes.
-
Run a Word Frequency query to get a feel for what respondents are saying.
-
Create charts to visualize the data—for example if you setup demographic data, you could create a chart to see how many cases are male and aged 50 to 59.
Refer to Approaches to analyzing survey results for more detailed information.