

Run a Coding Comparison query
This feature is available in NVivo Pro and Plus editions. Learn more
Compare coding done by two users to measure the 'inter-rater reliability' or degree of agreement for coding between the users.
In this topic
- Understand Coding Comparison queries
- Create a Coding Comparison query
- How is the percentage agreement calculated?
- How is the Kappa coefficient calculated?
- How should the value of Kappa be interpreted?
- Why can the value of Kappa be low when the percentage agreement is high?
- What does a negative Kappa coefficient mean?
- All my Kappa coefficients are 0 or 1. Is something wrong?
- How can I calculate an average Kappa coefficient or percentage agreement across multiple sources or nodes?
Understand Coding Comparison queries
A Coding Comparison query enables you to compare coding done by two users or two groups of users.
It provides two ways of measuring 'inter-rater reliability' or the degree of agreement between the users: through the calculation of the percentage agreement and 'Kappa coefficient'.
-
Percentage agreement is the number of units of agreement divided by the total units of measure within the data item, displayed as a percentage.
-
Kappa coefficient is a statistical measure which takes into account the amount of agreement that could be expected to occur through chance.
When you run a Coding Comparison query the results are displayed in Detail View:
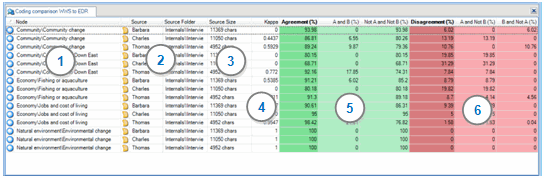
1 The node that contains the coding that is being compared.
2 The source name and source folder location.
3 The source size, which is calculated as follows:
-
Documents, datasets, memos and externals = number of characters
-
PDFs = number of pages and number of characters
-
Media file = duration in minutes/seconds/10ths of a second
-
Picture = the total number of pixels expressed as height multiplied by width
4 The Kappa coefficient—this column is only available if you select Display Kappa Coefficient. If the users are in complete agreement then the Kappa coefficient (K) = 1. If there is no agreement among the raters (other than what would be expected by chance) then the Kappa coefficient (K) ≤ 0.
5 The green columns show percentage agreement:
-
Agreement Column = sum of columns A and B and Not A and Not B
-
A and B = the percentage of data item content coded to the selected node by both Project User Group A and Project User Group B
-
Not A and Not B = the percentage of data item content coded by neither Project User Group A and Project User Group B
6 The red columns show percentage disagreement:
-
Disagreement Column = sums of columns A and Not B and B and Not A
-
A and Not B = the percentage of data item content coded by Project User Group A and not coded by Project User Group B
-
B and Not A = the percentage of data item content coded by Project User Group B and not coded by Project User Group A

Create a Coding Comparison query
You cannot use the Query Wizard to run a Coding Comparison query—these queries must be set up outside the Wizard, as described below:
-
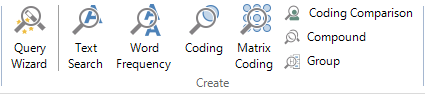
On the Query tab, in the Create group, click Coding Comparison.
The Coding Comparison Query dialog box opens.
-
Select the users to include in user groups A and B in the Compare coding between box:
-
User group A box—click Select and select the users.
-
User group B box—click Select and select the users.
-
In the At box—click Select to choose specific nodes or nodes in selected sets, classifications or Search Folders.
-
In the Scope box, click Select to choose specific sources.
-
Select what you want to include in the results:
-
Select Display Kappa Coefficient to show this in the result.
-
Select Display percentage agreement to show this in the result.
-
Click Run.
When the query has executed, the results are displayed in detail view.
NOTE
-
To save the Coding Comparison query, select the Add to Project check box and enter the name and description (optional) in the General tab.
-
If you include an 'aggregate' node in the scope of the query, content coded at the node and all its direct children will be included in the query results—refer to Aggregate nodes for more information.
-
To view the content that has been coded, right-click on a selected row. You can select to Open Node or Open Source to review the coding in detail.
-
Although you cannot save the query results within NVivo, you can export the results of a Coding Comparison query to other applications such as Excel. Refer to Export query results for more information.
How is the percentage agreement calculated?
NVivo calculates percentage agreement individually for each combination of node and source.
Percentage agreement is the percentage of the source’s content where the two users agree on whether the content may be coded at the node.
For example, if the source is a document with 1000 characters, where:
- 50 of these characters have been coded by both users
- 150 of these characters have been coded by only one of these users, and
- the remaining 800 characters have not been coded by either user
then the percentage agreement is calculated as (800 + 50) ÷ 1000 = 85%.
For other types of sources, different units are used instead of characters for this calculation. For example, for audios and videos the unit of measurement is seconds of duration, and for pictures the unit of measurement is image area in pixels.
How is the Kappa coefficient calculated?
Cohen’s Kappa coefficient is a statistical measure of inter-rater reliability which many researchers regard as more useful than the percentage agreement figure, since it takes into account the amount of agreement that could be expected to occur through chance. For more information, refer to the Wikipedia article Cohen's kappa.
NVivo calculates the Kappa coefficient individually for each combination of node and source.
If the two users are in complete agreement about which content of the source should be coded at the node, then the Kappa coefficient is 1. If there is no agreement between the two users (other than what could be expected by chance), the Kappa coefficient is ≤ 0. A value between 0 and 1 indicates partial agreement.
The Kappa coefficient is calculated as follows. (Note that the units of measure used in this calculation depend on the source type. For example, for documents the units of measure are characters, while for audios and videos the units of measure are seconds of duration.)
-
Calculate the expected frequency by which the agreement between users could have occurred by chance (ΣEF), by summing:
-
The number of units of the source’s content coded at the node by user A, multiplied by the number of units coded at the node by user B, divided by the total number of units in the source (EF1)
-
The number of units of the source’s content not coded at the node by user A, multiplied by the number of units not coded at the node by user B, divided by the total number of units in the source (EF2)
-
Expected frequency (EF) of the agreement occurring by chance = EF1 + EF2
-
Calculate the Kappa coefficient (K) as equal to:
-
Total units of agreement between the two users (TA) minus the expected frequency (ΣEF) of the agreement occurring by chance, divided by the total units (TU) within the source minus the expected frequency (ΣEF) of the agreement occurring by chance: K = (TA – ΣEF) ÷ (TU – ΣEF)
-
In the case where both users are in complete agreement as to how the source’s content should be coded at the node, then the value of Kappa will equal 1
For an example of how NVivo calculates Kappa coefficients, you can download the Coding Comparison Calculation Examples spreadsheet. The Kappa values in column F are calculated (using spreadsheet formulae) from the agreement/disagreement figures in columns H, I, K and L.
How should the value of Kappa be interpreted?
One approximate set of guidelines for interpreting the value of Kappa is:
| Kappa value | Interpretation |
| Below 0.40 | Poor agreement |
| 0.40 – 0.75 | Fair to good agreement |
| Over 0.75 | Excellent agreement |
Why can the value of Kappa be low when the percentage agreement is high?
Because the Kappa coefficient calculation takes into account the likelihood of the agreement between users occurring by chance, the value of Kappa can be low even though the percentage agreement is high.
For example, if most of a source has not been coded at the node by either user, but each user has coded completely different small sections of the source at the node, then the percentage agreement between the users will be high. But since this situation would be highly likely to occur by chance (i.e. if the two users had each coded a small section at random), the Kappa coefficient is low.
Conversely, if most of a source has not been coded at the node by either user, but each user has coded almost the same sections of the source at the node, then the percentage agreement between the users will again be high. But this situation would be highly unlikely to occur by chance, so the Kappa coefficient is also high.
These examples indicate why many researchers regard the Kappa coefficient as a more useful measure of inter-rater reliability than the percentage agreement figure.
What does a negative Kappa coefficient mean?
A Kappa coefficient less than or equal to zero indicates that there is no agreement between the two users (other than what could be expected by chance) on which content in the source may be coded at the node.
All my Kappa coefficients are 0 or 1. Is something wrong?
This most often indicates that one of the two users being compared has not coded any of the selected sources at the selected nodes.
In your Coding Comparison query results:
-
If the columns “A and B (%)” and “A and Not B (%)” are both entirely full of zeros, then user A has not coded any of the sources at the selected nodes
-
If the columns “A and B (%)” and “B and Not A (%)” are both entirely full of zeros, then user B has not coded any of the sources at the selected nodes
If the user’s work has been imported from another NVivo project, this may indicate that this user’s coding has not been imported correctly and needs to be re-imported.
When using the Import Project feature in NVivo to import coding:
-
Be sure to choose the option “Merge into existing item” for duplicate items
-
When selecting which data to import, do not choose the option “Selected (excluding content)”
-
If you choose the option “Selected (including content)”, be sure to select to import “Coding” in the Import Options dialog
How can I calculate an average Kappa coefficient or percentage agreement across multiple sources or nodes?
NVivo calculates the Kappa coefficient and percentage agreement individually for each combination of node and source.
However, the results of a Coding Comparison query can be exported from NVivo as a spreadsheet (using the Export List command) to allow you to perform further calculations.
If you wish to calculate an average Kappa coefficient or percentage agreement for a single node across multiple sources, or for multiple sources and nodes, you will need to consider how you want to weight the different sources in the calculation. For example, do you want to treat each source equally, or do you want to give more weight to large sources than small sources?
For some examples of how average Kappa coefficients and percentage agreements can be calculated from Coding Comparison query results exported from NVivo, download the Coding Comparison Calculation Examples spreadsheet. This spreadsheet includes four examples (with the average Kappa coefficients and percentage agreements calculated using spreadsheet formulas):
-
Average figures for a single node across 3 sources (weighting each source equally)
-
Average figures for a single node across 3 sources (weighting each source according to its size)
-
Average figures for 5 nodes across 3 sources (weighting each source equally)
-
Average figures for 5 nodes across 3 sources (weighting each source according to its size)
If your project has different types of sources (for example, documents and audios), you may need to give further consideration to how you want to weight these different sources (since document size is measured in characters, while audio size is measured in seconds of duration).