About maps
This feature is available in NVivo Pro and Plus editions. Learn more
Visualizations tools such as maps play an important role in qualitative research—use maps to explore your ideas or to present the connections in your data.
You can use paper and pen or a whiteboard to generate maps, but using the tools in NVivo gives you the flexibility of moving items and shapes around, and quickly and easily changing format and layout. Working in NVivo means you can also easily modify your maps as new or additional data becomes available.
In this topic
What are maps?
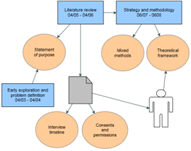
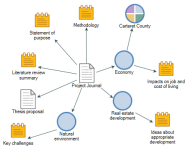
There are three types of maps in NVivo and you might use them at different stages of your project for different reasons.
| Use a | When you want to | Example layout |
|
Mind map |
Brainstorm your ideas and visualize your thoughts. Refer to About mind maps for more information. |
 |
|
Concept map |
Define concepts and think through their connections. Refer to About concept maps for more information. |
 |
|
Project map |
Display the items and links in your project. Refer to About project maps for more information. |
 |
The benefits of mapping
Just like talking about your research, the very activity of putting your information into a visual diagram encourages you to make decisions about what to include and what to omit. You are obliged to find a place for each object and to check each connection.
Making maps requires and ensures a thorough knowledge and understanding of your data. Mapping can also stimulate the generation of new ideas.
Condensing your research into a restricted space (a screen or page) naturally helps you to:
-
Identify what's most important.
-
Distinguish discrete pieces of data.
-
Establish likely relationships or connections.
Ideas for working with maps
Many of these ideas for working with maps are inspired by the book Qualitative Data Analysis in NVivo (written by Pat Bazeley and Kristi Jackson).
What can I use maps for?
You can use maps in a variety of ways, for example:
-
Constructing—Sort themes to build your node hierarchy. Explore alternatives for your node structure—to see what belongs in the same tree or group.
-
Analyzing—Develop ideas and visualize theories.
-
Determining—See who or what is involved in a phenomenon or process, their relationships and possible causal pathways.
-
Discovering—Perceive emerging themes and connections that you might not have anticipated. Reveal any apparent problems or gaps in your data.
-
Explaining—Express your interpretation of the data. Use evidence to show associations. Communicate your central understanding to an audience. Build a visual narrative.
When to create maps
You can create maps at any stage of your project—from developing your research question, through analysis and developing theory to presentation of results.
Use maps early on to sharpen the focus of your study, clarify your research question or plan your data collection. Mapping at this stage can help you to identify any assumptions you hold about your topic and how concepts might relate to each other. Mapping early can also alert you to the need to include particular people in your sample or to explore a particular context.
Mapping during analysis encourages deep thought, helping you build your knowledge about your research topic and gain a greater understanding of your project items.
Even at the final stage, preparation of a visual view of your research will stretch your analytic thinking. Make a habit of it—it is much easier to present your results visually if you have regularly created maps during your project.
Keeping copies of your maps
Progressively refine your maps as you proceed through your analysis. Because mapping is iterative, don’t throw your first versions away—save progressive copies of your maps as images so that you can:
-
Create an audit trail for your project.
-
Retain a historical record of your evolving ideas as you continue to develop them.
-
See if your predictions are correct.
-
Revert changes.
-
Gain familiarity with how your research presents graphically so that when you come to your final write-up, you can include a visualization with impact.


