

About project maps
This feature is available in NVivo Pro and Plus editions. Learn more
Project maps are a graphic representation of the different items in your project. Create a project map to explore and present the connections in your data.
You build project maps. If you want to see your project data mapped for you, use an explore diagram to step through your project items and their connections.
In this topic
Watch the video
What are project maps?
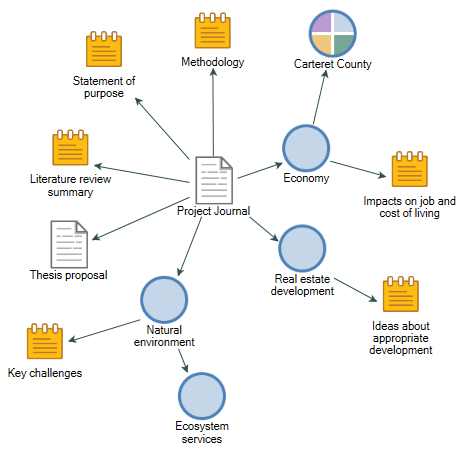
Project maps are a way of visually exploring or presenting the data in your project. Project maps are made of shapes that represent the different items in your project and connectors which show links between items. You need some project data before you can create a project map.
To get started with a project map, you need to frame a question you want to ask of your project data. For example, how have these sources been coded? Which cases are assigned to this classification? What are the attributes defined for this classification? Then, add the project items that are central to your question to the canvas to build up a visual representation of your enquiry. Add other, associated items to the canvas to help illustrate the answer.
You can use project maps to:
-
Explore and organize data.
-
Develop ideas, build theory and make decisions.
-
Identify emerging patterns, theories and explanations.
-
Visually represent the links between project items.
-
Provide a record of stages in a project.
When you create project maps, save an image in your project journal and record your observations and insights.

When should I create a project map?
| At this stage of your project | Create a project map to |
|
During analysis |
|
|
Developing theory |
|
|
Presenting results |
|