

About social network analysis
This feature is available in NVivo Plus edition. Learn more
Social network analysis focusses on the links between people or other social entities. Sociograms in NVivo can assist you in analyzing social networks by displaying them as a diagram—helping you to visualize connections.
Use sociograms to perform social network analysis on a population of cases and their relationships, or on a Twitter dataset created from NCapture import.
Egocentric and network sociograms are based on relationships between cases. Twitter sociograms are based on retweets and mentions between users—refer to Approaches to analyzing Twitter data for more information.
In this topic
- Watch the video
- What are sociograms?
- What can I use sociograms for?
- Types of sociograms in NVivo
- Understand the sociogram Detail View
- Types of edges
- Understanding metrics in sociograms
Watch the video
What are sociograms?
Sociograms are a graphic representation of the social links between people or other entities.
Sociograms are made up of vertices and edges:
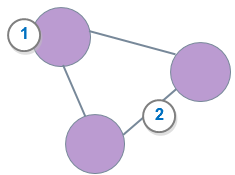
1 Vertex—represents a person, group or entity. In NVivo, vertices are cases (or Twitter users in a Twitter sociogram).
2 Edge—represents a connection or interaction between vertices. In NVivo, edges are relationships (or tweets and mentions in a Twitter sociogram). Edges can have arrow heads indicating the direction of the relationship.

What can I use sociograms for?
Use sociograms to explore networks and answer questions about social interdependence, for example:
-
Identify opinion leaders or influential people in communities
-
Reveal vulnerable populations
-
Study the flow of information within distinct communities
Types of sociograms in NVivo
| Use a | When you want to | Example |
|
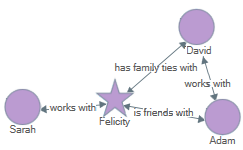
Egocentric sociogram |
See all the cases connected to one particular case (the ego). Refer to Work with egocentric sociograms for more information. |
|
|
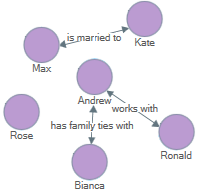
Network sociogram |
Visualize a group of cases to see how they are connected. This type of sociogram can include isolated cases. Refer to Work with network sociograms for more information. |
|
|
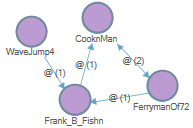
Twitter sociogram |
Visualize your Twitter dataset from NCapture—to see the network of your Twitter users, and how they are connected by retweets and mentions. Refer to Approaches to analyzing Twitter data for more information. |
|
Understand the sociogram Detail View
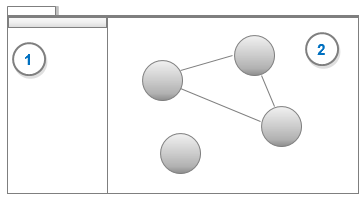
1 The sociogram options pane. Use the options on this pane to display different relationship types or to change the color or size of the vertices. When you select an option on this pane, the sociogram may need to redraw.
2 The sociogram canvas.
Types of edges
The direction of an edge in a sociogram has meaning.
-
Undirected edges are associative relationships—they have no directionality (for example, "has met" )
 .
. -
Directed edges are one way relationships (for example, "is a member of", "Twitter @mention" )

-
Symmetrical edges link both ways ("Facebook friends with")

NVivo sociograms are multiplex networks, meaning that different kinds of connections (edges) are shown on the one network. For example, Twitter sociograms show mentions and retweets; network sociograms show all types of relationships.
Understanding metrics in sociograms
Vertex metrics are used to calculate different measures of influence such as degree, betweenness and closeness to answer questions like:
-
How many people can this person reach directly?
-
Which person is most likely to have the most information flowing through them?
-
How fast can this person reach everyone in the network?
Network metrics like density and reciprocity are used to calculate the level of connectedness for a network.
You can view the scores of the centrality measures underlying the connections displayed in a sociogram in grid format. For more information, refer to Understand sociogram centrality measures.