Choosing the best approach for your project
Every research project is unique—the way you organize and analyze the material depends on your methodology, data and research design.
This topic presents some example scenarios for handling different types of projects—these are just suggestions to get you up and running. Feel free to share your own ideas and strategies on the QSR Forum.
In this topic
- A study of exploring stakeholder perception of a community arts program
- A study exploring community perceptions about climate change
- A literature review on adolescent depression
- Health project evaluating a maternal support program
- A study of the language used by members of an online community
- An investigation into communication flow in an organization
- A quick analysis of a local government budget consultation survey
- Ways to get started with your project
- Working toward outcomes that are robust and transparent
A study of exploring stakeholder perception of a community arts program
Your source materials consist of unstructured interview documents. You would set up a case node for each interview participant, then code to theme nodes and case nodes. You could then explore your data with simple queries or charts, and use memos to record your discoveries.
A study exploring community perceptions about climate change
Some of the features described here are only available in NVivo Pro and NVivo Plus.
Your source materials consist of structured, consistently formatted interviews (where each participant is asked the same set of questions). You could auto code the interviews and set up cases for each participant. Then code themes to query and visualize your data.
A literature review on adolescent depression
Some of the features described here are only available in NVivo Pro and NVivo Plus.
Your source materials consist of journal articles, books and web pages. You would classify your sources before coding and querying them; and then you could critique each source in a memo.
Health project evaluating a maternal support program
Some of the features described here are only available in NVivo Pro and NVivo Plus.
Your source materials consist of in-depth interviews and observation notes. You would set up cases and code themes before querying your data. You could then summarize the material in a framework matrix to compare attitudes.
A study of the language used by members of an online community
Some of the features described here are only available in NVivo Pro and NVivo Plus.
Your source materials consist of Facebook data captured with NCapture. You would import it as a dataset ready to code and query. Use memos to record your insights.
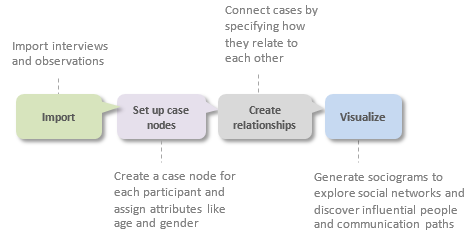
An investigation into communication flow in an organization
This feature is available in NVivo Plus.
Your source materials consist of in-depth interviews and observation notes. You would set up cases and then create relationships between them, so that you could visualize social networks using egocentric and network sociograms.

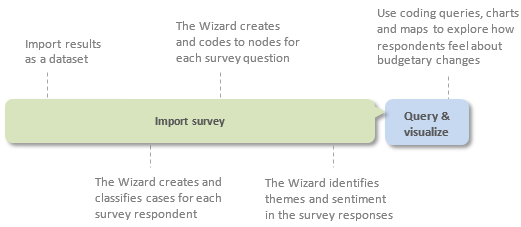
A quick analysis of a local government budget consultation survey
This feature is available in NVivo Plus.
Your source material is a large dataset of survey responses. You would import it using the Survey Import Wizard, which prepares your data for analysis. As part of the import, choose to run automated insights to identify and code at themes and sentiment so that you can quickly review results and report broad findings.
Ways to get started with your project
Some of the features described here are only available in NVivo Pro and NVivo Plus.
Since projects (and researchers) are unique there is no one 'best practice' approach to organizing and analyzing your data but there are some useful strategies to help you get up and running:
-
Start now - don't wait until you have collected all the data. Import your research design, grant application, thesis proposal or literature review.
-
Make a project journal and state your research questions and record your goals. Why are you doing the project? What is it about? What do you expect to find and why? What biases do you bring to the project? Update the journal regularly to stay focused and to show the evolution of your project.
-
Make a concept map for your preliminary ideas. Show the relationships or patterns you expect to find in your data based on prior experience or preliminary reading.
-
Import your interviews, field notes, focus groups, pictures, videos, surveys, web pages or social media content. Organize these sources into folders for easy access.
-
Set up an initial node structure based on your early reading and ideas—you could run a Word Frequency query over your data to tease out the common themes for creating your node structure.
-
Set up case nodes for the people, places or other cases in your project.
-
Explore your material and code themes as they emerge—create memos and describe your discoveries and interpretations.
-
To protect your work, get in the habit of making regular back-ups and avoid storing your project on a network or external device.
-
Let yourself be informed, redirected and surprised by your data.
Working toward outcomes that are robust and transparent
Using NVivo to organize and analyze your data also increases the 'transparency' of your research outcomes—for example, you can:
-
Demonstrate the evolution of your ideas in memos and maps.
-
Document your early preconceptions and biases (in a memo or map) and demonstrate how these have been acknowledged and tested.
-
Easily find illustrative quotes.
-
Always return to the original context of your coded material.
-
Save and revisit the queries and visualizations that helped you to arrive at your conclusions.
If you are using NVivo Pro or NVivo Plus, you can demonstrate the credibility of your findings in the following ways:
-
If you used NVivo for your literature review, run a query or create a chart to demonstrate how your findings compare with the views of other authors.
-
Was an issue or theme reported by more than one participant? Run a Matrix Coding query to see how many participants talked about a theme.
-
Were multiple methods used to collect the data (interviews, observations, surveys)—and are the findings supported across these data sources? Run a Matrix Coding query to see how often a theme is reported across all your sources
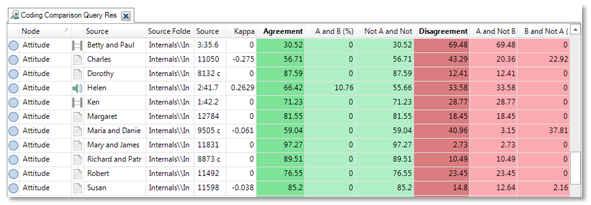
-
If multiple researchers analyzed the material—were their findings consistent? Use coding stripes (or filter the contents in a node) to see how various team members have coded the material and run a Coding Comparison query to assess the level of agreement.