

Work with egocentric sociograms
This feature is available in NVivo Plus edition. Learn more
Generate an egocentric sociogram when you want to see how a particular case is connected to other cases in your project, and how those cases are connected to each other.
What do you want to do?
- Watch the video
- Understand egocentric sociograms
- Create an egocentric sociogram
- Change the relationships displayed on the sociogram
- Change the number of steps shown on the sociogram
- Change the display of the sociogram based on centrality measures
- Filter vertices displayed on the sociogram
- Change the display of the edges in a sociogram
- View the centrality measures for the sociogram
Watch the video
Understand egocentric sociograms
Egocentric sociograms display all the cases connected to one particular case (the ego).
The diagram is made up of vertices (representing cases) and edges (showing relationships). The ego is displayed as a star shape.
The relationships between cases are labelled.
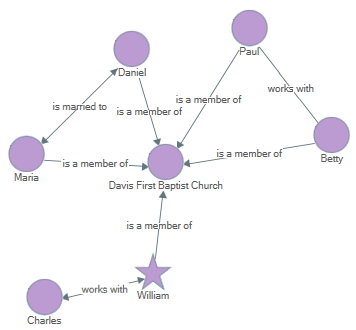
In this example, the sociogram is based on William (the ego). The diagram shows that:
-
William works with one other case, Charles.
-
William is connected with four other cases through his membership at the Davis First Baptist Church.

Create an egocentric sociogram
-
In List View, select a case.
-
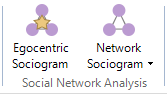
On the Explore tab, in the Social Network Analysis group, click Egocentric Sociogram.
The sociogram displays in Detail View.
NOTES
-
Use the Zoom slider on the Status bar to zoom in or out.
-
Click and drag shapes to move them around.
-
Save the sociogram as an image—refer to Copy and export sociograms.
-
You can undock Detail View to work with the sociogram in a separate window.
-
The density and reciprocity scores for the network display in the Status bar.
Change the relationships displayed on the sociogram
You can change which relationships are displayed but note that all cases are still displayed on the sociogram—only the relationship connectors are shown or hidden.
To show or hide relationships:
-
On the Sociogram Options pane, in the Include Relationships section, select or clear the check box for the relationship type you want to show or hide connectors for. A Click to redraw button displays on the sociogram canvas.
-
Click the Click to redraw button. All cases are still displayed on the diagram—only the relationship type connectors you have selected are shown.
Change the number of steps shown on the sociogram
Steps refer to the degree of separation from the ego. You can show up to 3 steps:
-
1 step will show cases with only a direct relationship to the ego
-
2 steps will include cases with an indirect relationship to the ego
-
3 steps will include any cases with a relationship to any other case on the diagram
To change the number of steps on the sociogram:
-
On the Sociogram Options pane, in the Display section—in the Steps list, select the number of steps you want to display. A Click to redraw button displays on the sociogram canvas.
-
Click the Click to redraw button.
Change the display of the sociogram based on centrality measures
You can alter the display of vertices based on their metrics in the sociogram—according to degree, betweenness and closeness. Refer to Understand sociogram centrality measures for more information.
-
On the Sociogram Options pane, in the Display section, do any of the following:
-
In the Size vertices by list, select the centrality measure you want to use to resize the vertices.
-
In the Color vertices by list, select the centrality measure you want to use to color the vertices.
A Click to redraw button displays on the sociogram canvas.
-
Click the Click to redraw button.
Vertices are sized and colored based on a scale. The vertices with the highest value for the centrality measure you chose to display will be largest or colored the darkest; the vertices with the lowest value will be the smallest or colored the lightest.
Filter vertices displayed on the sociogram
You can filter the vertices that are displayed on the sociogram based on a threshold of a centrality measure.
-
On the Sociogram Options pane, in the Display section, in the Filter vertices by list, select the centrality measure you want to filter by. A graph displays beneath the list.
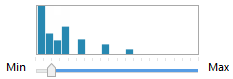
The x-axis of the graph ranges from a minimum of 0 to a maximum of 1, in increments of 0.05. The vertices in the network are represented on the graph based on the centrality measure you have selected to filter by.
Use your mouse to hover over a bar on the graph to see the total number of vertices at that increment on the range.
-
Click and drag the slider to a point on the range that you want to filter the sociogram.
-
Click the Click to redraw button. Only the vertices with a score of the increment you selected or higher are displayed on the sociogram.
Change the display of the edges in a sociogram
You can alter the display of the edges in a sociogram based on their weight.
-
On the Sociogram Options pane, in the Display section, in the Scale edge weight by list, select the option you want to use to display the edges. A Click to redraw button displays on the sociogram canvas.
-
Click the Click to redraw button.
Edges are weighted according to the number of relationships between vertices. Thicker edges indicate more relationships or in the case of Twitter sociograms, more retweets or mentions—thinner edges indicate the less.
View the centrality measures for the sociogram
You can display the centrality measures for the connections in a sociogram in grid format.
-
On the Sociogram tab, click Centrality Measures.
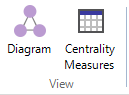
Click Diagram on the ribbon to return to the sociogram.
The grid lists values for the following centrality measures:
-
Degree
-
Degree In
-
Degree Out
-
Betweenness
-
Closeness
The density and reciprocity scores for the network display in the Status bar.
Refer to Understand sociogram centrality measures for more information.