

Example reports
This feature is available in NVivo Pro and Plus editions. Learn more
When you build your own reports using the Report Wizard, you choose a view of the underlying data. Below are example reports that are based on each of the views. Refer to Understand views and fields for more information.
In this topic
- Participants grouped by demographic
- Themes coded at cases
- List of nodes and their description
- Count of sources by classification
- Nodes coding selected sources
Participants grouped by demographic
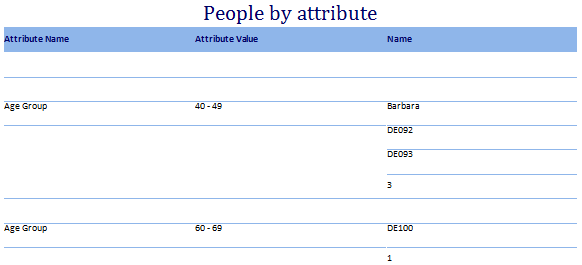
Use the Case Classification view to report on classifications, attributes and attribute values used to describe the people, places and other cases in your project.
For example, the report below lists the case nodes grouped by attribute value for a selected attribute, for example, age group, with a count for each.
To create this report using the Report Wizard:
-
On the Explore tab, in the Reports group, click New Report. The Report Wizard opens.
Step 1 - Choose a view
-
In the From a view list, select Case Classification.
-
Click Next.
Step 2 - Select fields
-
In the Available fields list, expand Node.Attribute Value.
-
Select Attribute Name and Attribute Value and add them to the Selected fields list.
-
Expand Classification.Node and add Name to the Selected fields list.
-
Click Next.
Step 3 - Filter the report
-
Click Add.
-
Click the first Select button. The Filter Fields dialog opens.
-
Expand Node.Attribute Value, click Attribute Name and then click OK.
-
Click the second Select button, expand the classification, click the attribute and then click OK.
-
Click Next.
Step 4 - Add grouping levels
-
Move Node.Attribute Value.Attribute Name and Node.Attribute Value.Attribute Value to the Selected fields list.
-
Click Group Options. The Grouping Options dialog opens.
-
In the Grouping levels box, select Node.Attribute Value.Attribute Value.
Classification.Node.Name is displayed under summary values.
-
From the list, select Count records.
-
Click Footer to display the totals below the detail records and then click OK.
-
Click Next.
Step 5 - Sort the detail records
-
Select Classification.Node.Name.
-
Click Next.
Step 6 - Select a layout
-
Click Block and click Next.
Step 7 - Select a style
-
Accept the default and click Next.
Step 8 - Name and describe the report
-
Enter a Name and Description for the report and click Finish.

Themes coded at cases
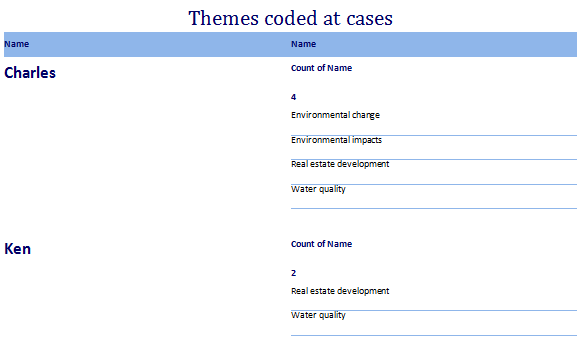
Use the Node view to report on the nodes in your project including sources they code, coding references, and any classifications assigned to them.
For example, the report below lists case nodes and the theme nodes that intersect them.
To create this report using the Report Wizard:
-
On the Explore tab, in the Reports group, click New Report. The Report Wizard opens.
Step 1 - Choose a view
-
In the From a view list, select Node.
-
Click Next.
Step 2 - Select fields
-
In the Available fields list, expand Node and add Name to the Selected fields list.
-
Expand Intersecting.Node and add Name to the Selected fields list.
-
Click Next.
Step 3 - Filter the report
-
Click Add.
-
Click the first Select button. The Filter Fields dialog opens.
-
Expand Node.Classification, click Name and then click OK.
-
Click the second Select button, click the classification and then click OK.
-
Click Next.
Step 4 - Add grouping levels
-
Move Node.Name to the Selected fields list.
-
Click Group Options. The Grouping Options dialog opens.
-
In the Grouping levels box, select Node.Name.
Intersecting.Node.Name is displayed under summary values.
-
From the list, select Count records and then click OK.
-
Click Next
Steps 5 to 7
-
Accept the defaults and click Next
Step 8 - Name and describe the report
-
Enter a Name and Description for the report and click Finish.
List of nodes and their description
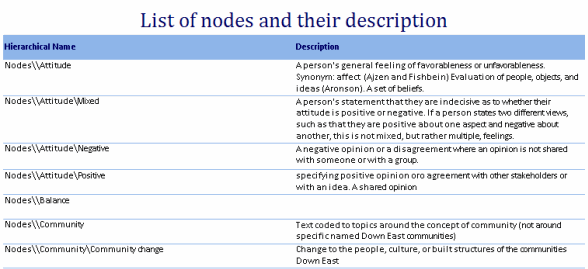
Use the Project Item view to report on the structure of your project. The example below lists the nodes along with a description and other relevant information that could be used as a codebook.
To create this report using the Report Wizard:
-
On the Explore tab, in the Reports group, click New Report. The Report Wizard opens.
Step 1 - Choose a view
-
In the From a view list, select Project Item.
-
Click Next.
Step 2 - Select fields
-
In the Available fields list, expand Folder.Project Item.
-
Select Hierarchical Name and Description, then add them to the Selected fields list.
-
Click Next.
Step 3 - Filter the report
-
Click Add.
-
Click the first Select button. The Filter Fields dialog opens.
-
Expand Folder, click Name and then click OK.
-
Click Equal to and then in the list, select In to change the type of filter—this will allow you to filter on multiple folders when you run the report.
-
Accept the default for the remainder of this filter.
-
Click Next.
Step 4 - Add grouping levels
-
Accept the defaults click Next.
Step 5 - Sort the records
-
Select Folder: Project Item.Hierarchical Name.
-
Click Next.
Steps 6 and 7
-
Accept the defaults click Next.
Step 8 - Name and describe the report
-
Enter a Name and Description for the report and click Finish.
NOTE When you run the report, select the check box next to Folder.Name and then click Select to select the folders containing the nodes you want to include in the report.
Count of sources by classification
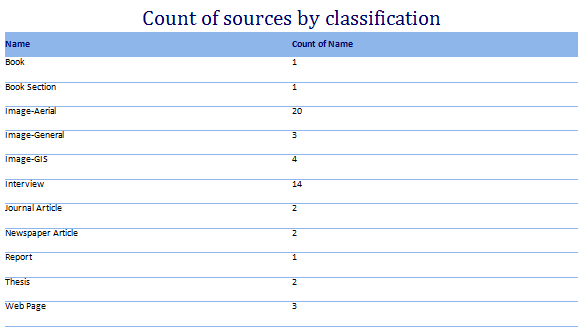
Use the Source Classification view to report on the classifications that are used to describe your sources. For example, the report below counts the number of sources that belong to each classification.
To create this report using the Report Wizard:
-
On the Explore tab, in the Reports group, click New Report. The Report Wizard opens.
Step 1 - Choose a view
-
In the From a view list, select Source Classification.
-
Click Next.
Step 2 - Select fields
-
In the Available fields list, expand Classification and add Name to the Selected fields list.
-
Expand Classification.Source and add Name to the Selected fields list.
-
Click Summary Options.
-
In the Classification.Source.Name list, select Count records and then click OK.
-
Click Next.
Steps 3 to 7
-
Accept the defaults and click Next.
Step 8 - Name and describe the report
-
Enter a Name and Description for the report and click Finish.
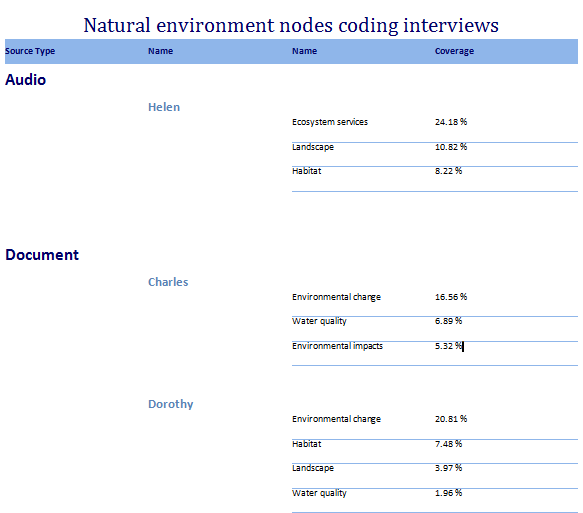
Nodes coding selected sources
Use the Source view to report on sources including which nodes code the sources. For example, the following report shows the nodes coded at particular sources in descending order of coding coverage.
To create this report using the Report Wizard:
-
On the Explore tab, in the Reports group, click New Report. The Report Wizard opens.
Step 1 - Choose a view
-
In the From a view list, select Source.
-
Click Next.
Step 2 - Select fields
-
In the Available fields list, expand Source.
-
Select Source Type and Name, and add them to the Selected fields list.
-
Expand Coding Node.
-
Select Name, Coverage and Number of Coding References, and add them to the Selected fields list.
-
Click Next.
Step 3 - Filter the report
-
Click Add.
-
Click the first Select button. The Filter Fields dialog opens.
-
Expand Source, click Name and then click OK.
-
Accept the default for the remainder of this filter.
-
Click Add. A new filter row is added.
-
In the new row, click the first Select button. The Filter Fields dialog opens.
-
Expand Coding Node, click Name and then click OK.
-
Accept the default for the remainder of this filter.
-
Click Next.
Step 4 - Add grouping levels
-
Move Source.Source Type and Source.Name to the Selected fields list.
-
Click Next.
Step 5 - Sort the detail records
-
In the first row of lists, select Coding Node.Number of Coding References and Descending.
-
Click Next.
Steps 6 to 7
-
Accept the default and click Next.
Step 8 - Name and describe the report
-
Enter a Name and Description for the report and click Finish.